
Discover how AI-powered data analytics with GraphAsk unlocks real business ROI. Transform data into decisions—fast, easy, and code-free.
In today’s competitive landscape, businesses need more than just data — they need ROI. That’s why AI-powered data analytics for business ROI has become essential.
Why ROI on Data Is a Competitive Advantage
Companies invest heavily in CRMs, ERPs, and data platforms. However, most still struggle to extract clear value.
Common Data Challenges:
- 🔒 Data silos across departments
- 🕒 Slow decision-making due to technical limitations
- 👨💻 High dependency on analysts and data engineers
Without fast, accessible insights, your data becomes a cost — not an asset.
Meet GraphAsk: Your Solution for AI-Powered Data Analytics for Business ROI
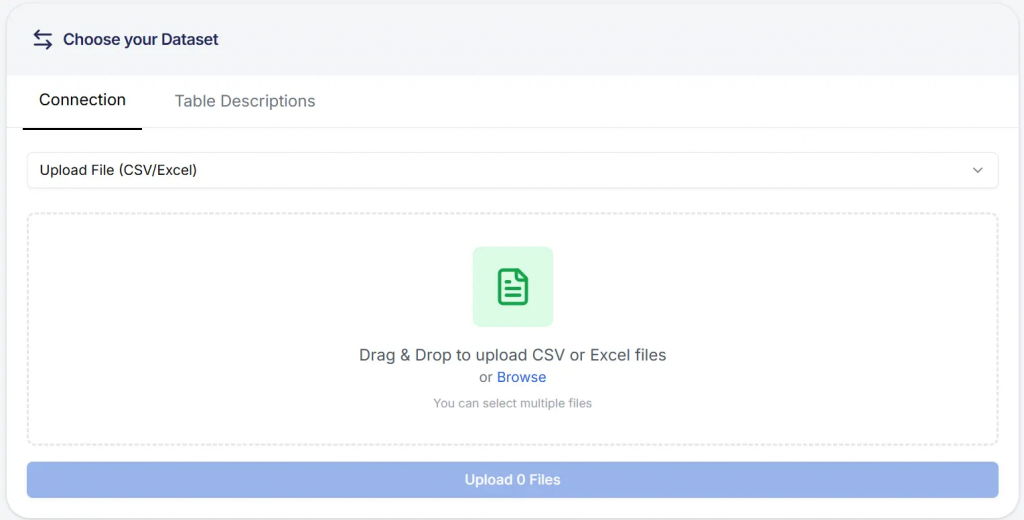
GraphAsk is an AI-driven data analytics platform that simplifies insights for business users, marketers, finance teams, and operations — no code required.
Key Features to Boost ROI:
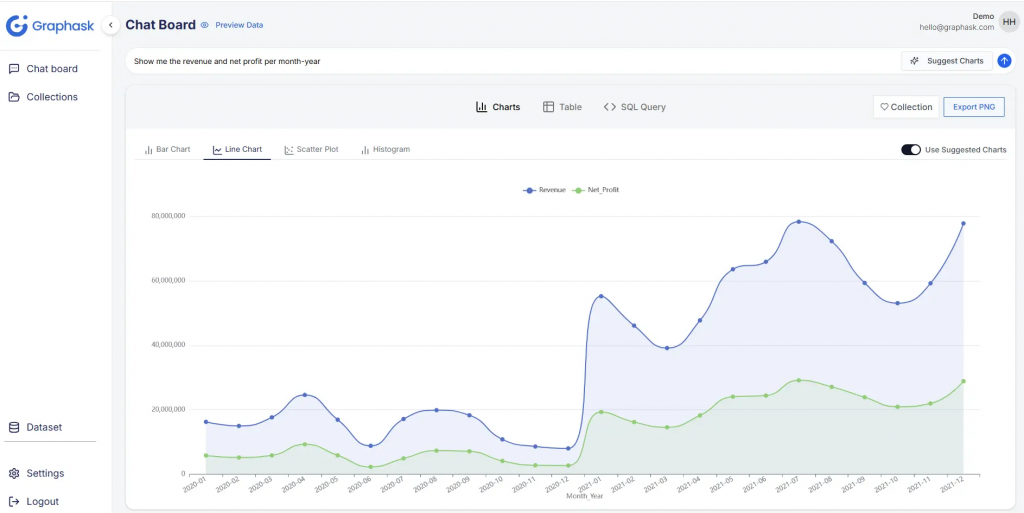
- 🔍 Natural Language BI Tools: Ask questions like “Sales by product category last quarter” and get instant answers.
- 📊 AI-Powered Dashboards: Visuals that update with your KPIs.
- 🤖 Automated Insights from Data: Detect anomalies, forecast trends, and make proactive decisions.
💬 Customer Testimonial:
“GraphAsk changed how we make decisions. Our marketing team now gets insights in minutes, not days — and we’ve seen a 30% boost in campaign ROI.”
— Sarah M., Marketing Director at RetailNova
The Evolution of AI in Business Analytics
AI in business analytics has evolved from basic reporting to intelligent, real-time insights. GraphAsk is at the forefront of this transformation, empowering teams to explore data through simple, conversational queries instead of complex code.
Real Use Cases of GraphAsk in Action
1. Sales Teams
- Predict demand
- Identify churn risks
- Track top-performing products
2. Marketing Teams
- Measure campaign performance
- Segment customers behaviorally
- Optimize budget in real-time
3. Finance & Operations
- Monitor expenses
- Spot cost inefficiencies
- Align cross-department KPIs
✅ Businesses report up to 40% increase in operational efficiency within 3 months of using GraphAsk.
GraphAsk vs. ThoughtSpot: What’s the Difference?
| Feature | GraphAsk | Traditional BI Tools / ThoughtSpot |
|---|---|---|
| Setup Time | Minutes | Weeks |
| Coding Required | ❌ None | ✅ Often Required |
| AI Integration | ✅ Built-in AI | ❌ Limited |
| Natural Language Interface | ✅ Yes | ⚠️ Partially Supported |
| Self-Service Analytics | ✅ Yes | ⚠️ Advanced Users Only |
📌 Related: Top 7 Data Visualization Tools in 2025
AI Across Industries
GraphAsk is not limited to one sector. Whether in healthcare, retail, logistics, or education, businesses are leveraging its AI capabilities to reduce costs, predict demand, and improve operations — all in real time
Why It Matters: AI Tools for Every Department
With AI-powered data analytics for business ROI, GraphAsk helps companies across industries unlock faster insights and measurable growth.
GraphAsk helps organizations across various industries:
- 🎓 Education: Visualize student performance and engagement.
- 🏥 Healthcare: Analyze patient data, optimize operations.
- 🛒 Retail: Understand buying behavior, manage inventory.
- 💼 Finance: Generate AI-powered reports in seconds.
Ready to Unlock AI ROI? Start Now.
Don’t let your data sit idle. With GraphAsk:
- ✅ Cut time-to-insight by 70%
- ✅ Enable self-service analytics for all teams
- ✅ Lower software and analyst costs
- ✅ Make strategic decisions faster
🎯 Start your free trial now or request a personalized demo
Learn More
📖 How to Chat with Your Data Using AI
🔗 What is Business Intelligence? – Gartner
